Useful Graphics to understand the Sea Level Rise
UNEP Graphic about sea level causes


Significance: Since the appearance of water on Earth, the variations of the global sea level is a constant phenomenon. Our actual sea level is amazingly low in comparison with the sea level 450 million years ago, which is assessed to 400 m higher than nowadays.
Curves: The two curves obtained by different geological measurements. The Vail Curve, or Exxon curve is based on data accumulated during petroleum exploration. It was published in 1977. The red curve, known as Haq sea-level Curve, is a revised version of the Vail Curve. It was published in 1977.

Significance: since the end of the last glacial era 20 000 years ago, the sea level rose by 120 m, until the stabilization 8000 years ago. Since that time, the global sea level didn’t rise or sink significantly.
Curve: it was the result of measurements taken in some coastal cities, such as Rio de Janiero, or countries, like Australia or Jamaica. It is based on date from Fleming et al. 1998, Fleming 2000, & Milne et al. 2005. Robert A. Rohde, PhD Student in Berkeley is the creator of this curve.
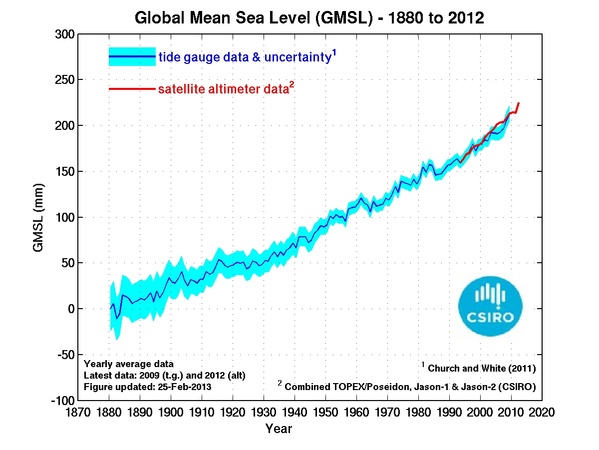
Significance: since reliable measurements can be made of the tide gauge, it seems that the sea level is rising. Since 1880, it would have risen by 200 mm (20 cm). The rise of the curve is relatively accelerating since 1950.
Curve: the data were collected yearly since 1880. The red curve is the product of a satellite in earth orbit since 2000.

Significance: the different scenarios regarding the sea level rise assess the rise is going to be included between 20 cm and 59 cm for the restraint assessments and between 10 cm and 88 cm for the large assessments. Regarding the future, the uncertainties are huge. The characteristics mainly used in the scenario are : population (increase or decrease), globalization (total or partial), energy (fossil or sustainable sources used).
Anyway, even with a 20 cm rise of sea level, the Micronesia islands will be flooded regularly.
Curves : Here is a UNEP graphic explaining the different scenarios. They were released in the 4th assessment of the IPCC in 2007.

____________________________
The impacts of sea level rise on small island states like Micronesia
Even if experts do not agree on the expected sea level rise it is certain that even a small rise could have dramatic consequences for biodiversity, economy and humans.
 For some regions like the Nile Delta, Bangladesh or the Netherlands the consequences of the sea-level rise would be a major catastrophe. Small island are particularly vulnerable because often their land area is only 3-4m above sea-level and is therefore disposed to be submerged if the sea rises. This is the case for the islands of the Federated States of Micronesia.
 The consequences of a sea-level rise could be coastal erosion, flooding, contaminated drinking water, rarefaction of fishes or plants. According to the IPCC around 33% of coastal land will be flooded in the next hundred years if the sea continues to rise. The World Bank forecasts that around one million people will have to be displaced because of the rising sea, leading to a migration problem.
 First of all Climate Change and the consequences of sea level rise destroy the biodiversity of small island states and more particularly coral reefs. Coral reefs are among the most valuable ecosystems on Earth but are threatened because of the impacts of increasing sea temperature and pollution. They protect costs from storms and erosion, provide a refuge for fishes and are an important factor for the economy of island states as it contributes to tourism and fishing. Their deterioration will have alarming consequences.
 The weather on small islands is strongly influenced by the ocean, and most of their economy rely on agriculture and tourism, both depending on the climate. Climate change will soon become a direct threat for the security of the local population, but before that it will change their way of life and their activity. Tourists are seeking nice weather and beaches, but the erosion due to the sea-level rise slowly destroys these beaches and threatens the infrastructures of the islands. A decline in the tourism sector would have great consequences on the economy and the employment rate of island states such as the FSM. This again would be negative for the fight against climate change. To secure the inhabitants from the rising sea, to protect the coral reefs and to make any kind of adaptation measures states need money. Furthermore the subsistence activity of agriculture and fishing is influenced by climate change and make the island states even more dependent on food import. Climate Change is also a direct threat for human health as it increases the risks of extreme weather events like cyclones and the spreading of infectious diseases like Malaria.
Climate change, and more particularly sea-level rise, is not only harming small island states economies, their ecosystem and their biodiversity but also their national identity and culture. Their isolated position has made their culture unique and very diverse. The declining economy and the threat of being flooded increases the so called environmental migration.
A lot of Micronesian already had to move to Australia and New-Zealand and there will be more and more in the future if the international organizations and the different governments don't take efficient actions to fight climate change !
A lot of Micronesian already had to move to Australia and New-Zealand and there will be more and more in the future if the international organizations and the different governments don't take efficient actions to fight climate change !
Climate Institute: OCEANS & SEA LEVEL RISE - Consequences of Climate Change on the Oceans http://www.climate.org/topics/sea-level/index.html
IPCC Report: The Regional Impacts of Climate Change - Chapter 9 Small Island States http://www.ipcc.ch/ipccreports/sres/regional/index.php?idp=239
In this video you can see how Climate Change already affects the Mirconesian island of Pohnpei
Aucun commentaire:
Enregistrer un commentaire